Time for some technical analysis talk.
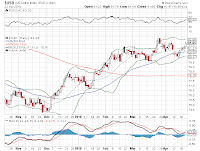
As you can see here, the US dollar has been making higher highs and higher lows on the daily chart. Additionally, the MACD and RSI have stayed above the water line.  The dollar has also moved back above its 50 day MA.
 The dollar has also moved back above its 50 day MA.
Note the similarity to the S and P 500 chart.


